A Key Market Warning Sign: Understanding the S&P 500 P/E Ratio
No matter how good a financial advisor claims to be, no one can predict the…


March 24, 2026

No matter how good a financial advisor claims to be, no one can predict the market. Yet it’s hard not to be worried when a steady drumbeat of experts spews conflicting opinions; some warn we’re headed for a correction, while others confidently claim there’s growth ahead. But here’s a clue: it’s not who you should listen to, but what. That what is the S&P 500 price to earnings ratio.
What is the S&P 500 Price to Earnings (P/E) Ratio?
Let’s break it down. The S&P 500 is comprised of the 500 largest companies. The price to earnings ratio is a calculation that’s used to understand whether those companies’ stocks are currently undervalued or overvalued. For the S&P 500 index, that’s calculated by taking the market cap of all 500 companies and dividing it by the sum of their earnings. The resulting number is your P/E ratio.
A lower P/E ratio can mean stocks are currently undervalued (sort of like buying on sale), while a P/E that’s too low can be an indicator of trouble. A higher P/E may be indicative of growth, but if it’s too high that could mean stocks are overvalued. And when stocks are overvalued, a correction might not be far behind.
How Has the S&P 500 P/E Ratio Been Trending?
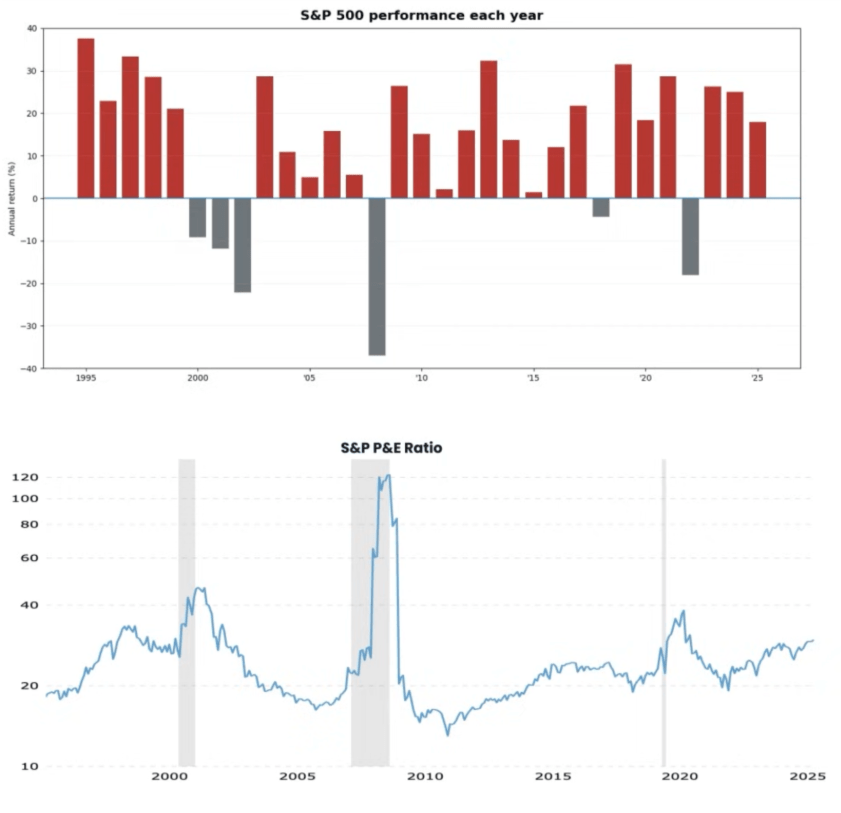
As of this writing, the S&P 500 P/E has consistently been at or near 30 for several months. That’s significant for a couple reasons. First, ratios above 25 are considered historically elevated, suggesting there may be overvaluation. In plain English: investors are paying a pretty penny for stocks. Federal Reserve Chair Jerome Powell flagged this in September of last year, as did the Fed’s semiannual financial stability report in November.
Which brings us to the second reason why a sustained ratio at or near 30 is significant: that key phrase, “historically elevated.” During the Dot Com bubble, the ratio exceeded 30 for 10 consecutive quarters. During the 2008 Global Financial crisis and COVID pandemic P/E similarly exceeded 30, but only because corporate earnings collapsed. And while some may argue there is a case to be made for high P/E being indicative of optimism for future earnings growth, history shows us there’s only so high we can go before a correction arrives.
Should You Be Worried?
The answer is no. But should you continue to pay attention to this indicator? It’s not a bad idea, with some caveats. First, consider how your money is currently invested. If you haven’t yet shifted your nest egg to lower-risk retirement appropriate investments, you may be unnecessarily gambling with your savings. In that case, you should act expediently. Our Market Risk Report, part of your personalized Roadmap for RetirementSM will help you identify the hidden dangers, so you can shift into safer investments that will continue to earn a good return.
And finally, it’s always important to examine P/E ratios in the context of larger chunks of time—think 3-5 or 10-year periods. At this stage, no one can say for certain how this higher P/E trend will shake out. But we do know that it’s a warning light we should keep an eye on.
Disclaimer: Numbers are for illustrative purposes only. Consult a professional for personalized advice.
_Page_01")
Share this article

No matter how good a financial advisor claims to be, no one can predict the…

There are some things in life where you’ll be fine to “wing it.” Unfortunately, paying for long-term…

Chances are you’ve already made assumptions about what your retirement will look like—whether it’s how often you plan to golf,…

Not sure where to put your retirement savings? There’s certainly no shortage of financial professionals’ hawking ideas; but whether…

By now you’ve probably heard plenty about the One Big Beautiful Bill; in fact, you…

You made it to retirement and if ever there were cause for celebration, this is…

For years you’ve dreamed about how you’ll spend your retirement, and now it’s finally here….

Feeling that nagging doubt about your retirement savings? You’re not alone. A recent study found…

“When should you start taking Social Security?” ranks among the top questions researched by retirees….

Retirement is a time to relax and enjoy the fruits of your labor. But how…

Ever wondered how much your financial advisor is really pocketing from your retirement nest egg?…

Retirement should be a time of relaxation and enjoyment, not financial stress or regret. Unfortunately,…

Retirement is a significant milestone, a time to reap the rewards of years of hard…

All our working lives, we dream of what we’ll do with the money we’ve saved…

Recently, a publication targeted toward financial advisors published an article wondering if advisor fees based…

As it turns out, “What Have You Done for Me Lately?” isn’t just a great…
“Set it and forget it,” is the financial industry’s refrain for retirement success; as in,…

Maybe You Shouldn’t Hang Out with Eddie In this adaptation from Golden Reserve Founder Greg…
“Making investment decisions is simple!” said no one ever. But what if there was a…

Downsizing is one of those ubiquitous practices that goes hand-in-hand with retirement, as if moving…

How much should you watch or act on information and predictions that you see on…

Every once in a while, you hear someone say something so succinct and spot-on, you’re…
In this episode: What is different from the big box firms and Golden Reserve with…
The new law raises the Required Minimum Distribution (RMD) age in two steps. The RMD age…

In this adaptation from Golden Reserve Founder Greg Aler’s new book, Fire Your Financial Advisor,…

Podcast: It seems like the Government has your back if your bank fails. Who has…

Golden Reserve Founder Greg Aler pulls back the curtain on how the trillion-dollar financial services…

Even if you love rollercoasters, chances are the rip-roaring stock market isn’t your kind of…

You don’t often hear the word trillion thrown around, unless we’re talking about the U.S….

Let’s talk about the alphabet soup that is the financial services industry. Between the CFPs,…

Poll your friends and family about annuities and you’re bound to get a lot of…

Let’s talk about commissions. For many professions—like real estate agents, sales professionals, brokers and artists—it’s…
Call it the new kid on the block. Fixed index annuities (FIA) are a more…

We recently heard a large, national firm use the slogan, “We do better when you…

We’ve written extensively about the risk of long-term care, but most people don’t want to…

No one likes extra fees, especially when they are hard to understand or being intentionally…

You probably don’t often think about how much your portfolio could go up or down…

Let’s start with a hard truth: you don’t actually own all the money in your…

What is an estate plan? How often should it be updated? What are the essentials…

The IRS may be switching up the regulations for inherited IRAs once again. If it…

We don’t have to explain why the yogurt in the back of your fridge expired….
Like many retirees or soon-to-be retirees, you’re probably hoping to pass on a little financial…

Before you go on a journey, you probably check to make sure you have…

When you open your IRA statement, it’s hard not to feel excited when you see…

If a friend or family member were to ask what your investment style is, would…

It All Comes Down to Want vs. Need Congratulations, you’re the next contestant on The…

Figuring out how and when to elect Social Security can be downright puzzling, especially when it comes to ensuring…

Signs Point to a Change Coming in Q4 Are you biting your nails over…

A report from the not-for-profit Insured Retirement Institute found 50% of boomers—including those who currently…
Ah, annuities: the product the financial services industry loves to hate. But are the hard…

Planning for retirement vs. planning in retirement. What’s the difference, you ask? If the question has you picturing Fred Astaire and Ginger Rogers crooning “to-may-to,…

Find Out What Each Type of Trust Does (or Doesn’t Do) For many of our…

Necessity is the Mother of Invention We’re often asked what the difference is between a retirement planner…

Secret #1: Financial Planners rarely, if ever, consistently beat index returns after netting out their…

Find Out What Makes Us Different from a Financial Advisor For most people, the financial…

Join Forces With Golden Reserve in This Year’s Walk to End Alzheimer’s® Alzheimer’s is anything but an…

If you read our article on the One Thing Your Retirement Plan is Probably Missing,…

Taking Action at These Junctures Can Pay Off When It Matters Most The word “taxes”…

You Could Go It Alone, But Here’s Why We Don’t Recommend It You might have…

Why Now May Be the Time to Act Thinking about retiring? If you have a…

The Two Taxes You’ve Never Heard of but Ought to Know About You’ve worked hard, paid your taxes, and—with the…

The Price Could Be Greater Than You Think Imagine you’re in the lightning round…
Don’t Let Them Have YOUR Cake and Eat It Too! Preparing for retirement is…

These changes to the capital gains tax would affect nearly everyone. Buckle up, retirees….

Know the difference between fixed and percentage fees Is it rude to ask someone how they make their money?…

No one wants to worry about running out of money. So why are so many plans missing this? Here’s a bit of trivia for you: What’s one of the…

Three Ways to Keep More of Your Hard-Earned Money The only thing that feels…

Let’s Talk About What Keeps You Up at Night If you’re losing sleep over…

Hope is Not Enough When it Comes to Long-Term Care It’s not fun to…

The long-awaited details of US President Donald Trump’s tax plan are finally beginning to emerge….

Just because retirees worry about their health care costs doesn’t mean they’re inclined to comparison…